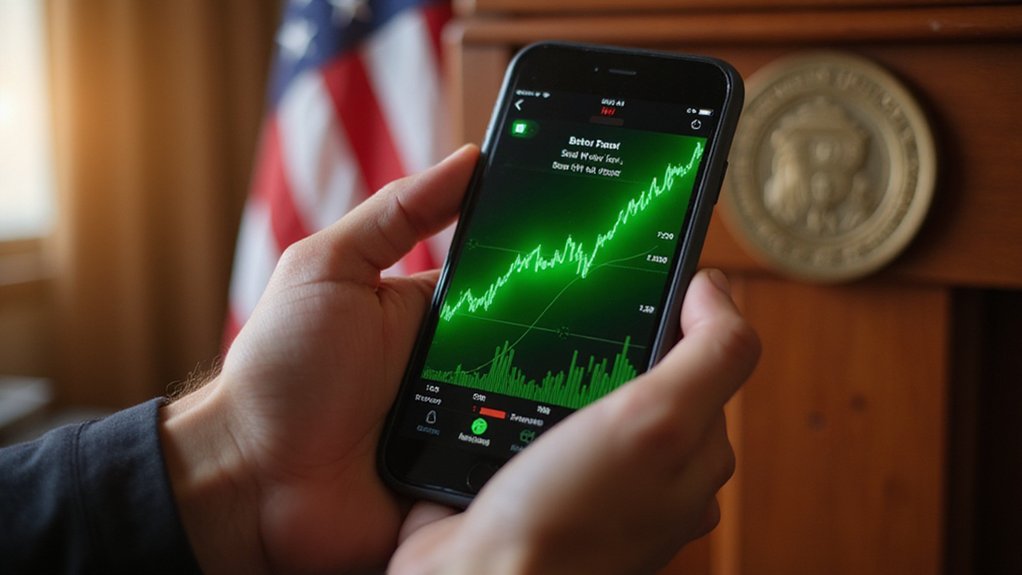
While Bitcoin’s propensity for theatrical price movements has become something of a market tradition, the cryptocurrency’s recent breakout from a bullish flag pattern on the 4-hour chart represents a textbook example of technical analysis in action—assuming, of course, that one subscribes to the notion that patterns drawn on price charts possess predictive powers beyond sophisticated tea leaf reading.
Bitcoin’s latest technical breakout assumes chart patterns possess predictive powers beyond sophisticated tea leaf reading.
The digital asset’s surge above the flag’s resistance zone propelled prices to a local high near $110,530, marking a continuation of upward momentum after consolidation since May 22, 2025. This breakout unfolded with remarkable velocity, completing within a single trading day—a pace that would make Formula One drivers envious and traditional equity investors reach for their blood pressure medication.
The technical milestone becomes particularly intriguing when considering Bitcoin’s proximity to its all-time high of $111,991, a psychological barrier that has proven as stubborn as a congressional budget negotiation. The cryptocurrency’s bounce from support near $98,000 provided the launchpad for this rally, demonstrating that even digital assets occasionally respect the fundamental principle that what goes down must eventually attempt to go back up (Newton’s lesser-known fourth law of motion, perhaps).
Institutional participation continues driving this bullish narrative, with firms like BlackRock expanding Bitcoin ETF offerings—because nothing says “revolutionary decentralized currency” quite like traditional financial institutions packaging it into familiar investment vehicles. Positive regulatory signals from U.S. authorities have enhanced investor confidence, while geopolitical instability reinforces Bitcoin’s appeal as a hedge against traditional market chaos. The emergence of Bitcoin ETFs as significant momentum drivers in 2025 has fundamentally altered the investment landscape, creating new pathways for institutional capital deployment.
The breakout’s validation through rising trading volume suggests genuine market conviction rather than algorithmic shenanigans or whale manipulation (though distinguishing between the two requires detective skills that would impress Scotland Yard). The current move demonstrates significantly faster acceleration than previous price actions during similar timeframes, indicating strong underlying momentum that could potentially carry Bitcoin through traditionally stubborn resistance levels.
Critical resistance levels now include the $110,000-$111,000 zone, with the $90,000 level representing significant Fibonacci retracement support.
Whether this technical breakout propels Bitcoin toward the ambitious $144,000 target remains a question that combines mathematical analysis with market psychology—a discipline that makes quantum physics appear invigoratingly straightforward by comparison. The cryptocurrency’s elevated volatility guarantees that predicting its trajectory requires equal parts technical expertise and fortune-telling acumen.


